Saturday, August 26, 2017

20170826

Initializations
The 500mb map indicates a broad high center over NV and all the way over to OK.  Southern Arizona has light easterly winds with quite cool temperatures, around -8C.  There may be a weak inverted trough over western Arizona with some associated clouds.  The rest of the SW US is clear.


The model initializations all look good mainly because the morning synoptic setup is simple.  Model confidence is high.


Day 1
Moisture has slowly increased over SE Arizona over the past day or so and is now in the mid 30mm range at Tucson.  Wet air continues over southern Arizona this afternoon with a bit of moisture trickling up from northern Mexico and from SW NM.


Moderate CAPE is in place over SE Arizona today which will support widespread storms in that area.


Tucson is right on the edge of the unstable air.  The morning sounding data indicated only a slight amount of CAPE.  By afternoon, even when using the wetter WRFNAM, only 300-500 J/kg are present. Too bad as the wind profile is quite good with northeasterly mid-level winds and upper SW winds.  The PBL is mixed deeply thus storms that form to the east of Tucson are likely to have very strong winds. A few outflows are likely to make their way into Tucson and may trigger a few weak storms.


Scattered storms develop over higher terrain in SE Arizona during the afternoon.


Storms continue over SE Arizona during the evening. (WRFRRx)


There is some disagreement how far the low-level SE flow penetrates into SE Arizona.  The WRFGFS has it the farthest west which then sets up a low-level convergence zone around Tucson.


The WRFGFS also has more CAPE with around 700 J/kg.  This is enough to support some storms in and around Tucson this afternoon.


Both the WRFNAM and WRFGFS have quite strong outflows moving through SE Arizona and into eastern Pinal and Maricopa late this afternoon.


There is very little CAPE forecast for Phoenix this evening so it’s unlikely that any storms form as the outflow moves through.


SE Arizona storms dissipate this evening.


Day 2
Mid-level steering is excellent over SE Arizona as it’s from the NE at about 10-20 knots.  This will steer whatever high elevation storms that form over east central Arizona towards the lower elevations.  Mid-level temperatures are again forecast to be fairly cool at around -9 to -6C.


Model runs are all over the place with regards to moisture.  Low-level E flow out of NM dries out SE Arizona in the WRFNAM while SE flow out of NM increases moisture in the WRFRRx!   Needless to say, the two runs are completely different as the WRFNAM has no activity in SE Arizona while the WRFRRx (below) has scattered storms there during the late afternoon and evening.  The WRFGFS is not available out to Day 2 as this is being written.


Just a comment on the idea that moisture from Harvey will somehow make it over here.  That looks impossible as strong low-level dry NE flow is present over all of northern Mexico by the 28th which pushes monsoon moisture to the west.


Wednesday, August 23, 2017

20170823

Eclipse
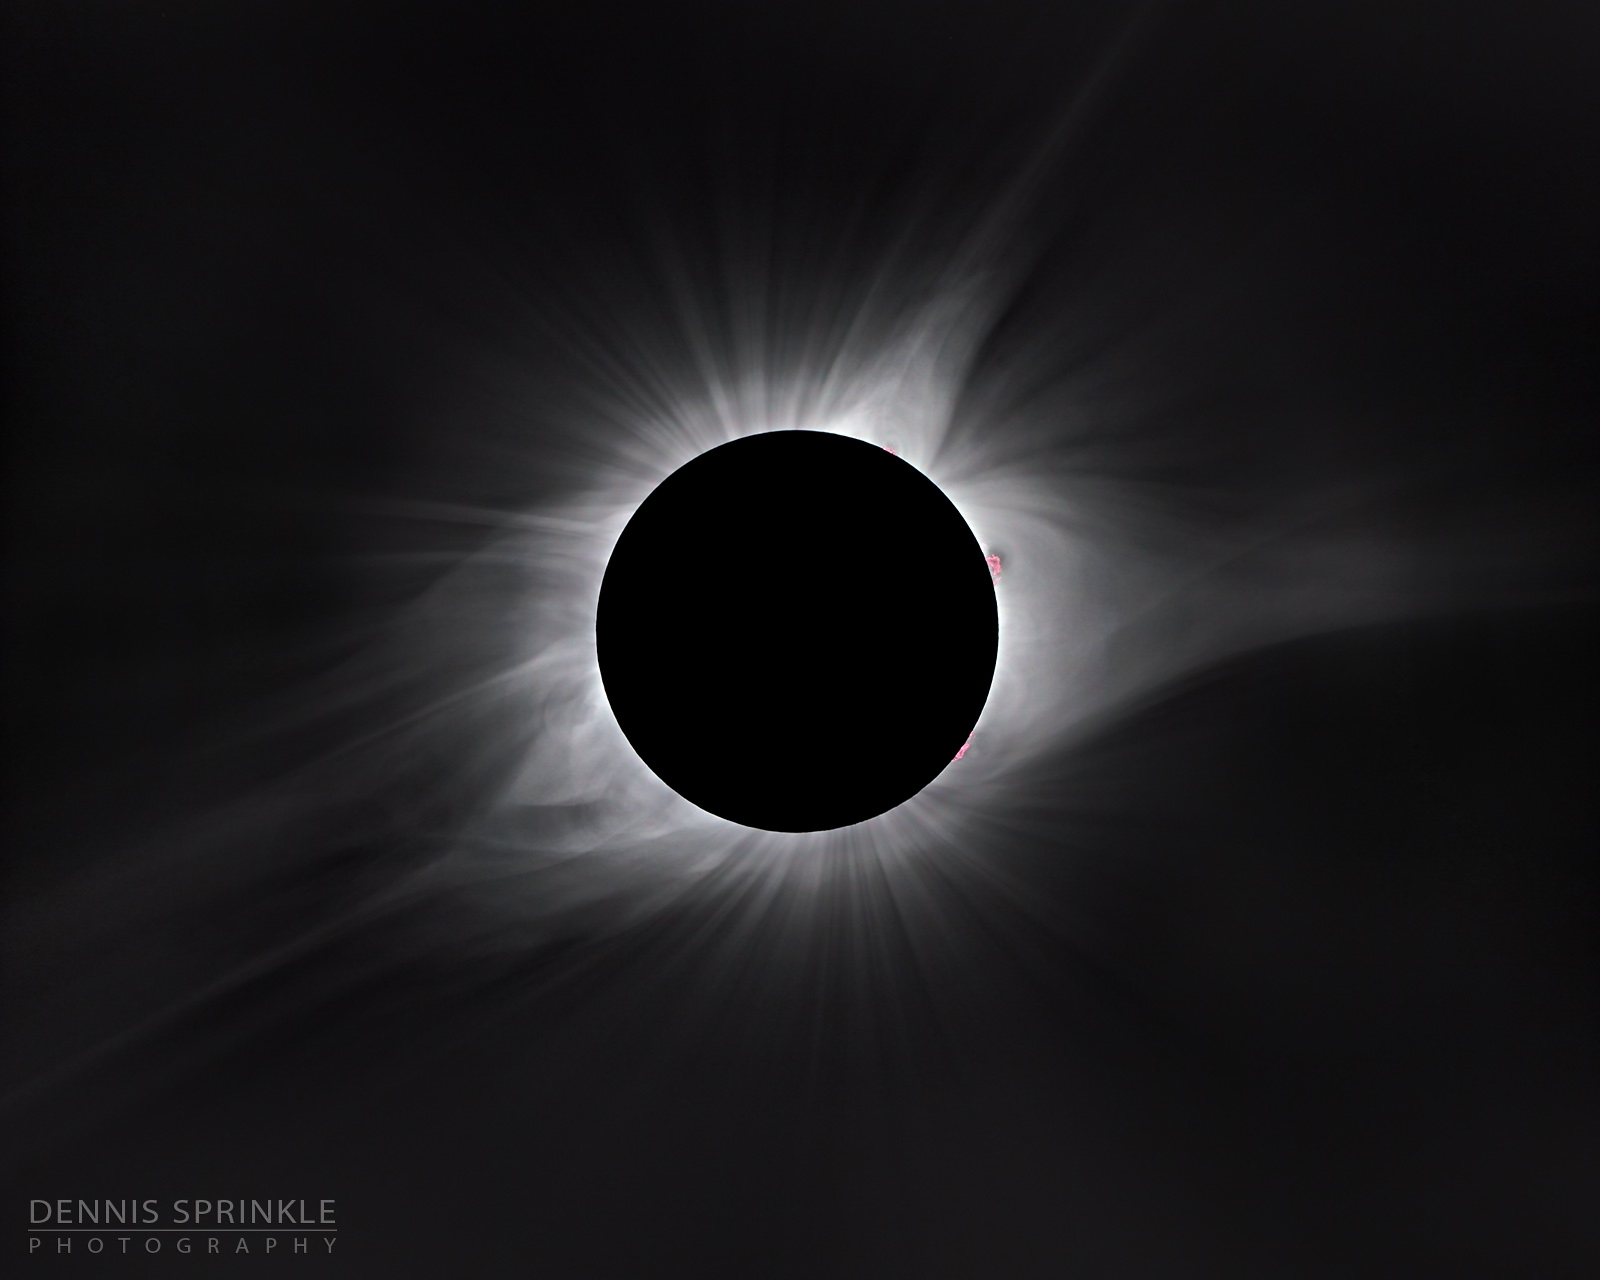
I’m back after a mostly successful trip to Idaho to see the total eclipse.  The weather could have not been better as a weak trough came through during the night and as it departed, 700mb winds became northwesterly which then cleared out all the smoke. A bit of cirrus associated with the trough moved to the east and by 9 am, skies were cloudless and a deep blue.  Once totality began, the corona was visible out a couple of solar radii and through binoculars, it was absolutely amazing with significant detail visible as well as three areas of prominences clearly visible.  Venus was very bright and Mercury could also be seen.  As some of you know, I’m an astrophotographer and I had a little f4.8 80mm refractor and astro camera with me.  My main goal was to watch as much of the eclipse as possible as at the last eclipse (1979!) I mostly monkeyed around with the camera and telescope and didn’t really watch the eclipse.  This time, I had automated the whole imaging process and I just had to push “start” on the computer and it would do everything and had practiced many times.  Once totality began,  I neglected to take the solar filter off of the telescope so all images were blank! My primary goal was accomplished though so I don’t feel too bad as there are plenty of great images available now. I also wanted to mention that many people in Boise thought that 99% would be “enough” and it wasn’t worth the 60-minute drive north for an extra 1%.  They could not have been more wrong.  You can’t see any of the corona or prominences/chromosphere or see how dark the immediate vicinity becomes.  Also, photographs are unable to capture the large dynamic range unless using HDR techniques and even then, they don’t give you the visceral feel of looking at this amazing spectacle with your own eyes.

This image taken by astrophotographer Dennis Sprinkle comes close.


Initializations
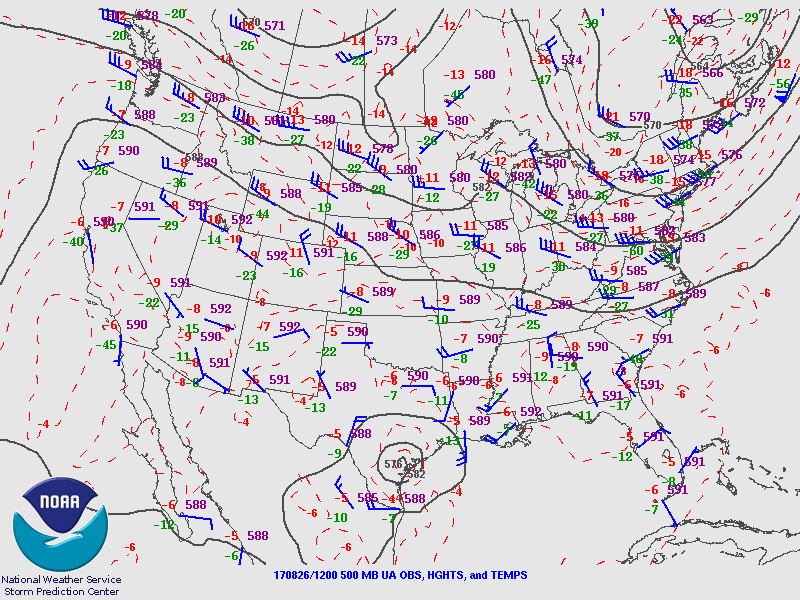
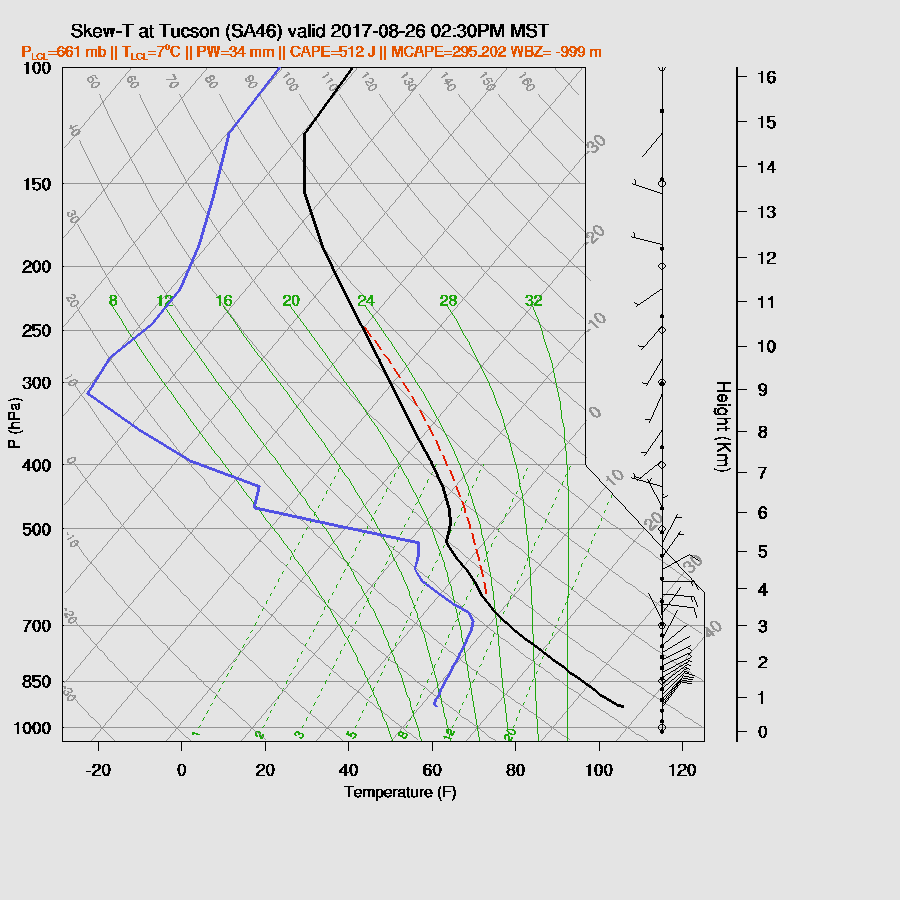
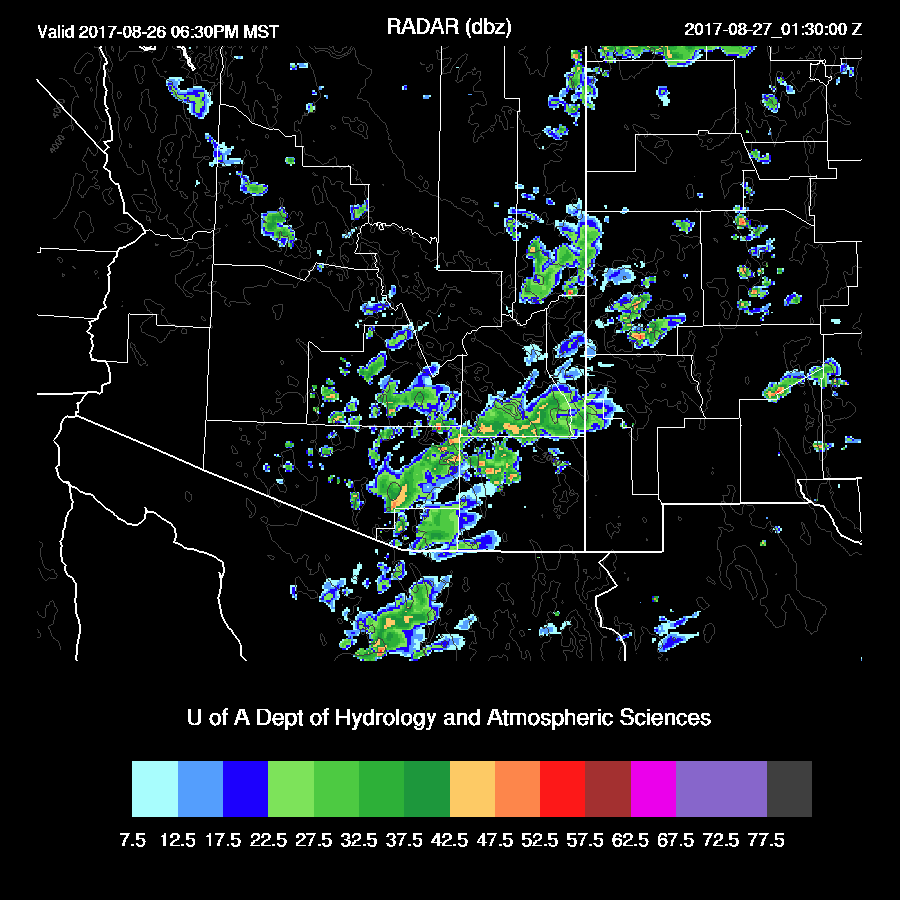
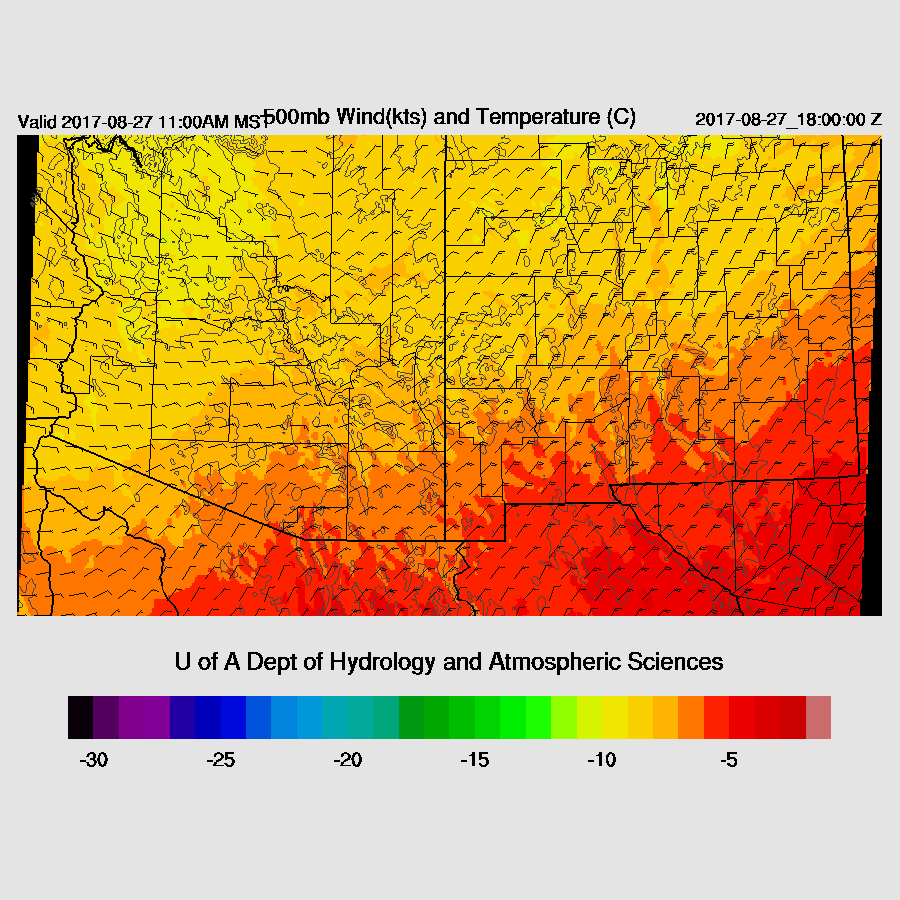
The model runs yesterday forecasted an increase in activity today.  Looking at the 500mb plot, the setup doesn't look all that great as the high center is just to the east of Tucson with mainly SW flow over most of the state.  Plus, 500mb temperatures are a warm -4C.  A weak MCV/IT is located over northern Sonora and is moving slowly north along with quite a bit of cloud.  Upper troposphere flow is quite strong as SW winds are above 50 knots at 250mb.   The morning sounding at Tucson does have 1100 J/kg of MLCAPE present along with wet air almost to 500mb. There’s a significant inversion just below 500 mb, but with enough heating and CAPE it will probably break at some point.  The RRx mid level initialization is good and does have the IT initialized. The GFS and NAM do not.   There are some thin mid level clouds over SE Arizona which are slowly dissipating.  The RRx and GFS actually have SE Arizona too cloudy while the NAM looks a bit clearer. IPW errors are mainly small except for a wet bias in all three, especially the GFS. Overall, it’s hard to say which is best due to the cloud issues in SE Arizona.  Elsewhere, the initializations look fair and there is no clear favorite.


Day 1
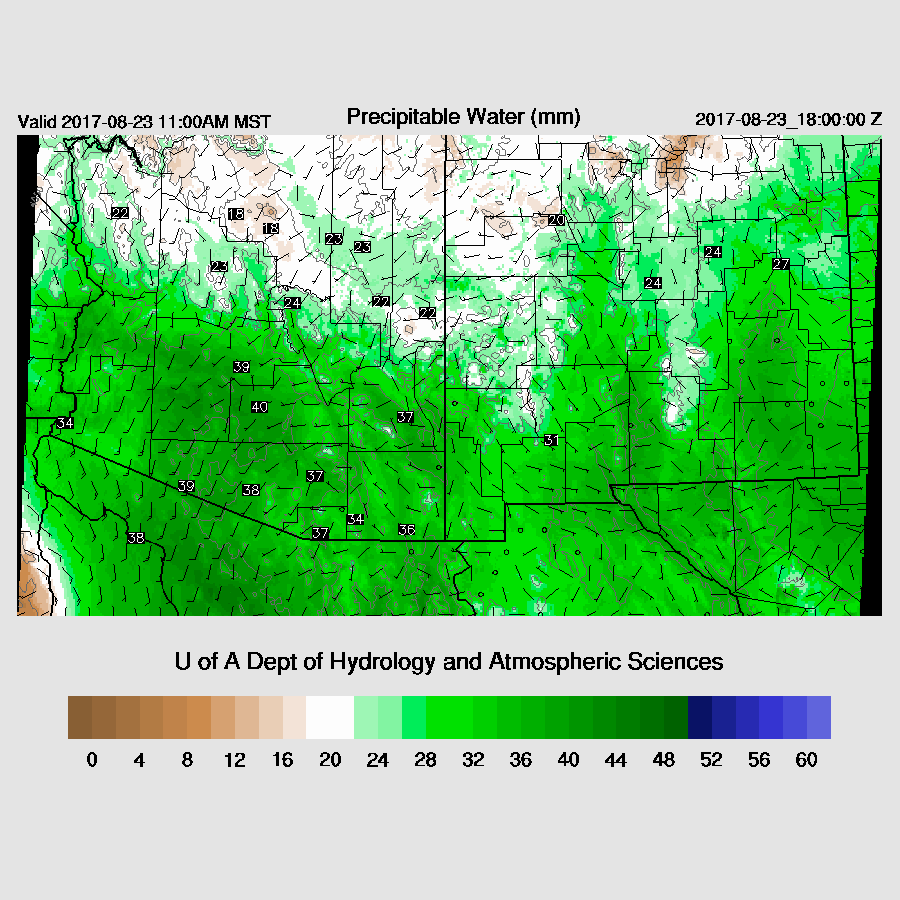
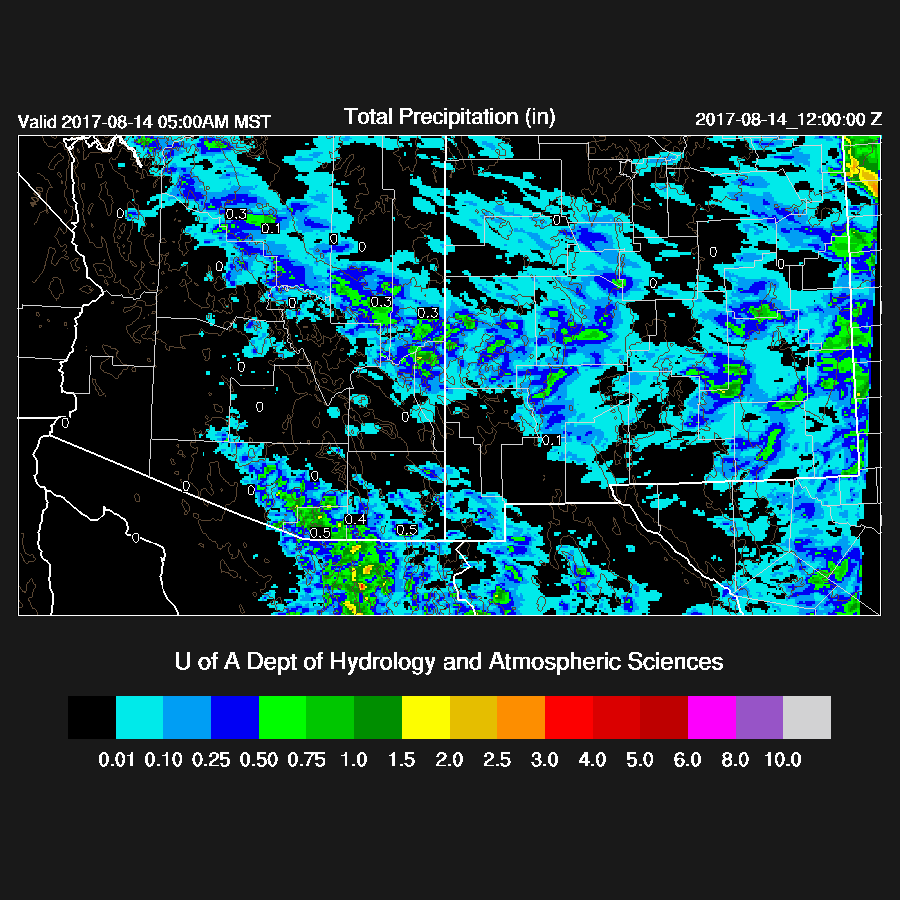
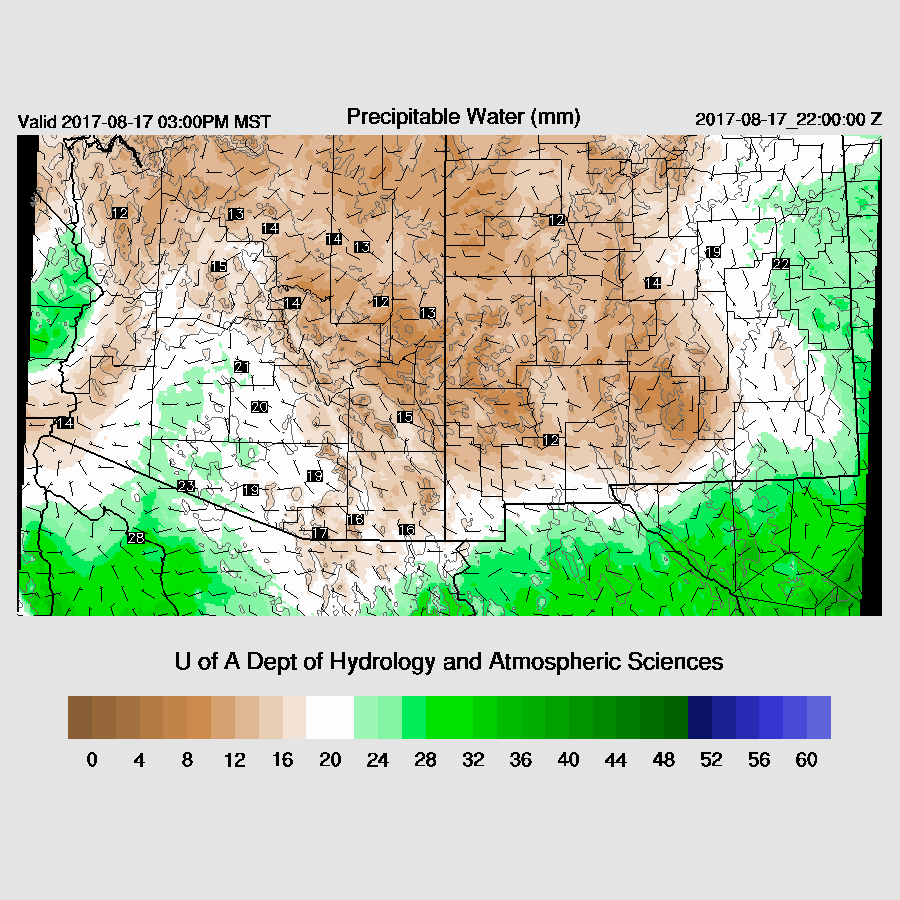
A weak gulf surge has increased moisture over southern Arizona and pushed IPW into the min 30mm range. The surge continues to advect moist air into the state during the day.


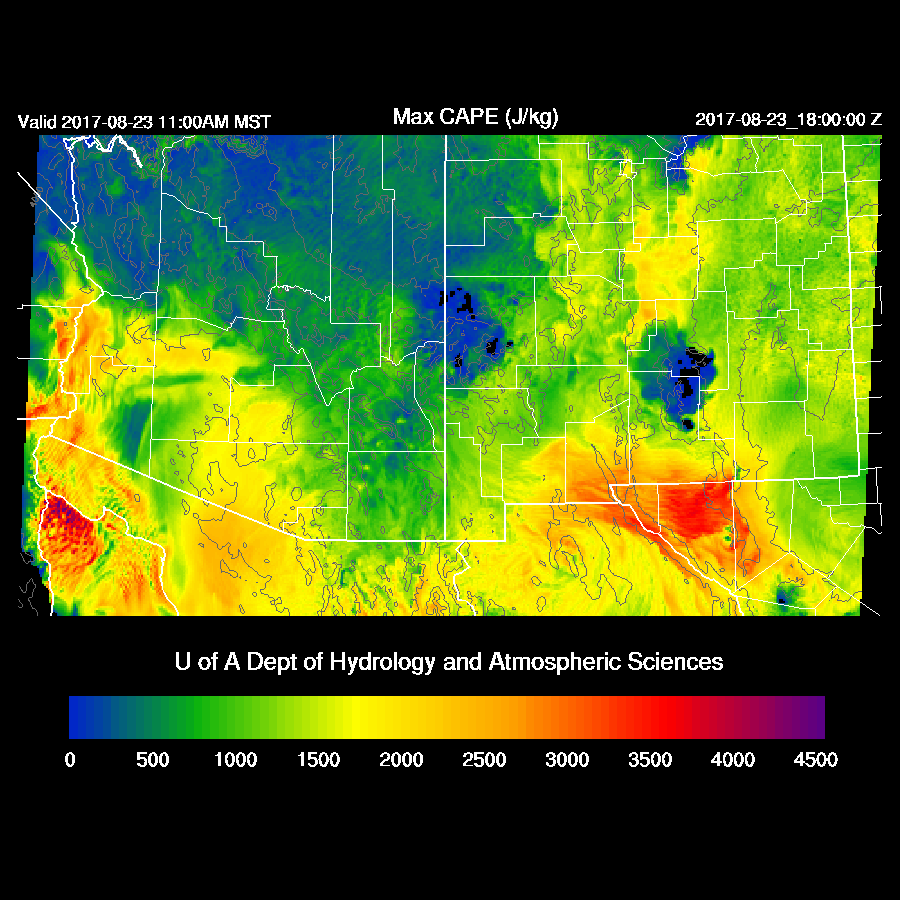
CAPE is forecast to be moderate to high over much of southern Arizona and into New Mexico.  The question is if there is enough heating to overcome the slight cooling in the lower troposphere due to the surge.


The WRFNAM and WRFRRx runs have the weak IT just south of Nogales by midday. This is too fast as the center of circulation is still about 200km south of the border at 17Z and the WRFGFS has the best initialization.  It may be important to get this right as this feature is likely to enhance and organize deep convection.   Another problem is that the three runs have a range of IPW early this afternoon from 34 to 41mm (WRFGFS).    The middle of the road is the WRFRRx which is below.  It has around 1000 J/kg but poor winds as they are mainly unidirectional from the SW.   So, my guess is there will be plenty of storms around SE Arizona but won’t show much organization.


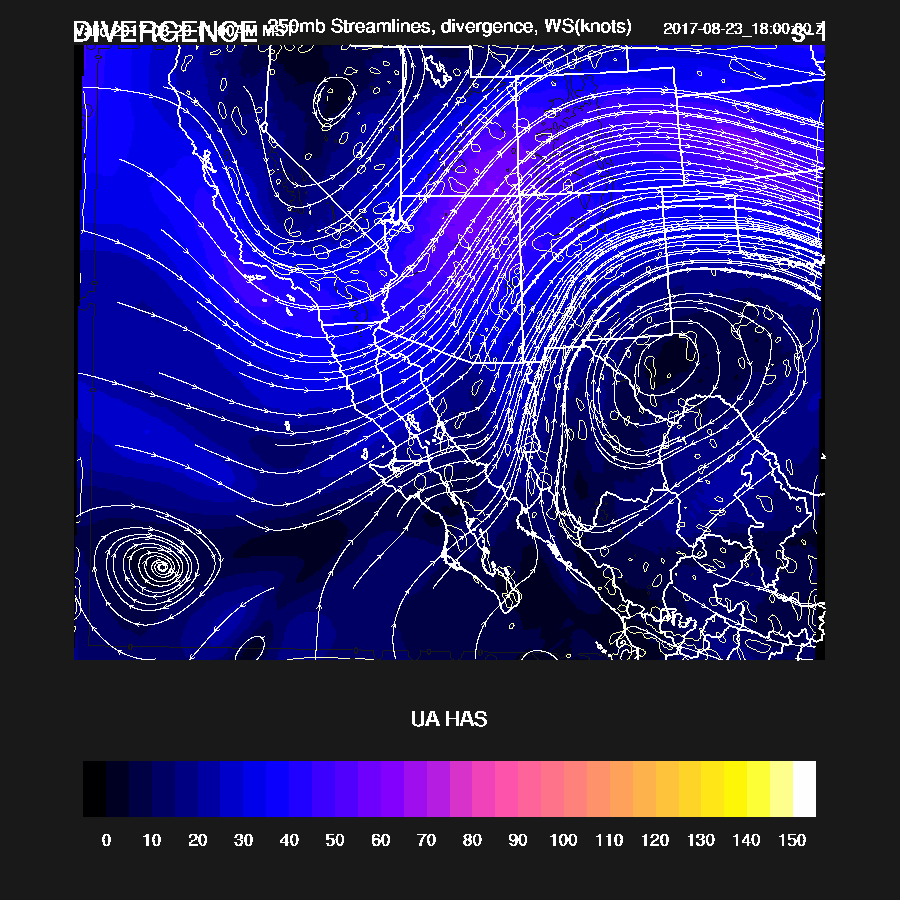
There are some areas of upper divergence over SE and east central Arizona which may help storm organization.  However, anvil shading may be a problem for lower elevations. Anvils will race ahead of the storms as mid level flow is only 15 to 20 knots.


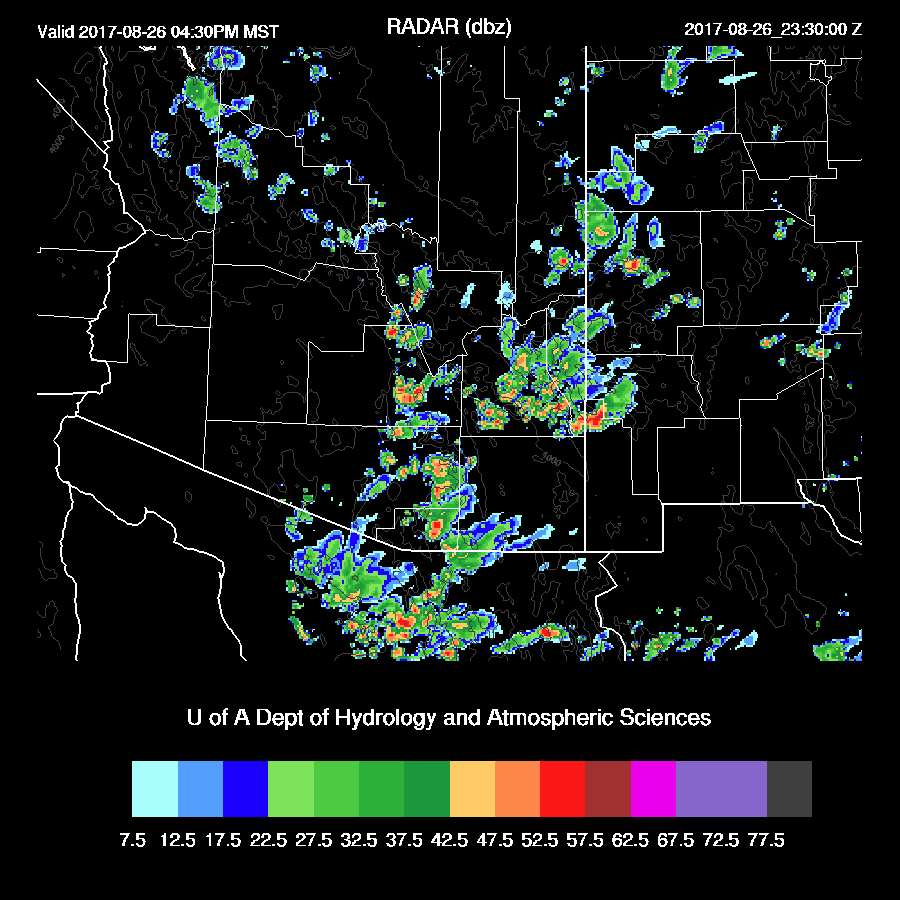
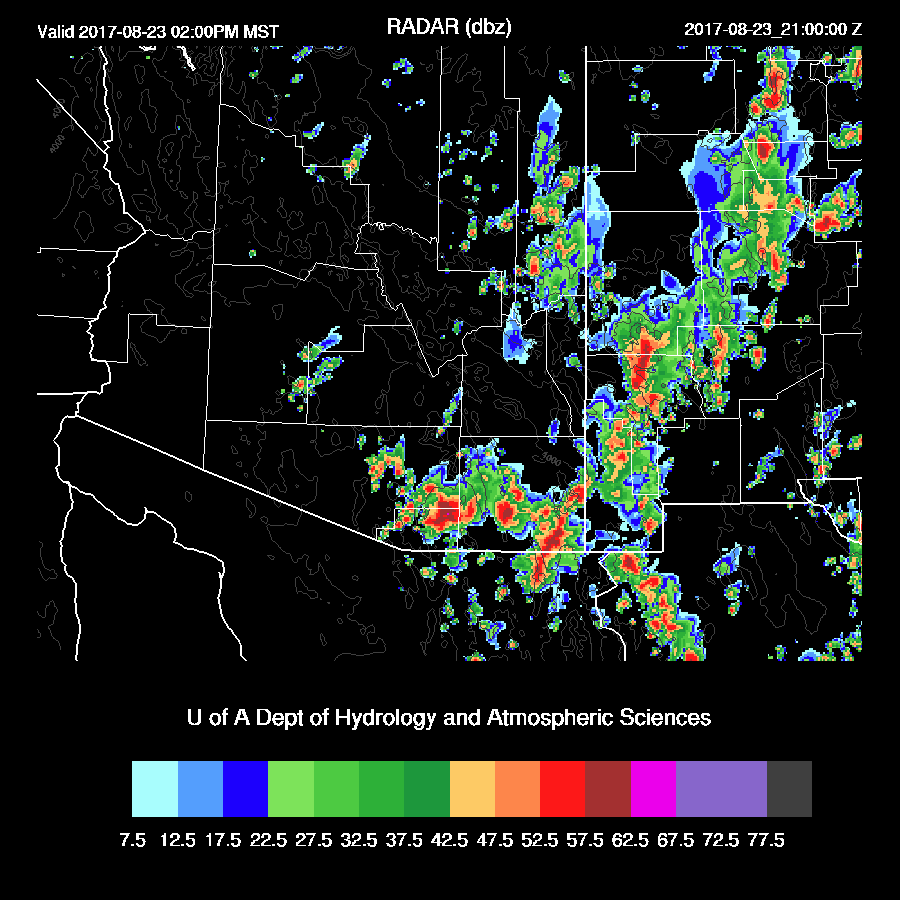
The general message that the three 12Z runs have a lot of activity around SE Arizona by early afternoon.  Some isolated severe storms are possible.  There is some uncertainty about the influence of the upper IT and its poor initialization in the WRFRRx and WRFNAM.


DCAPE from the 12Z Tucson sounding was quite high at around 1500 J/kg, thus there is a risk of strong to isolated severe microburst winds and strong outflow winds.


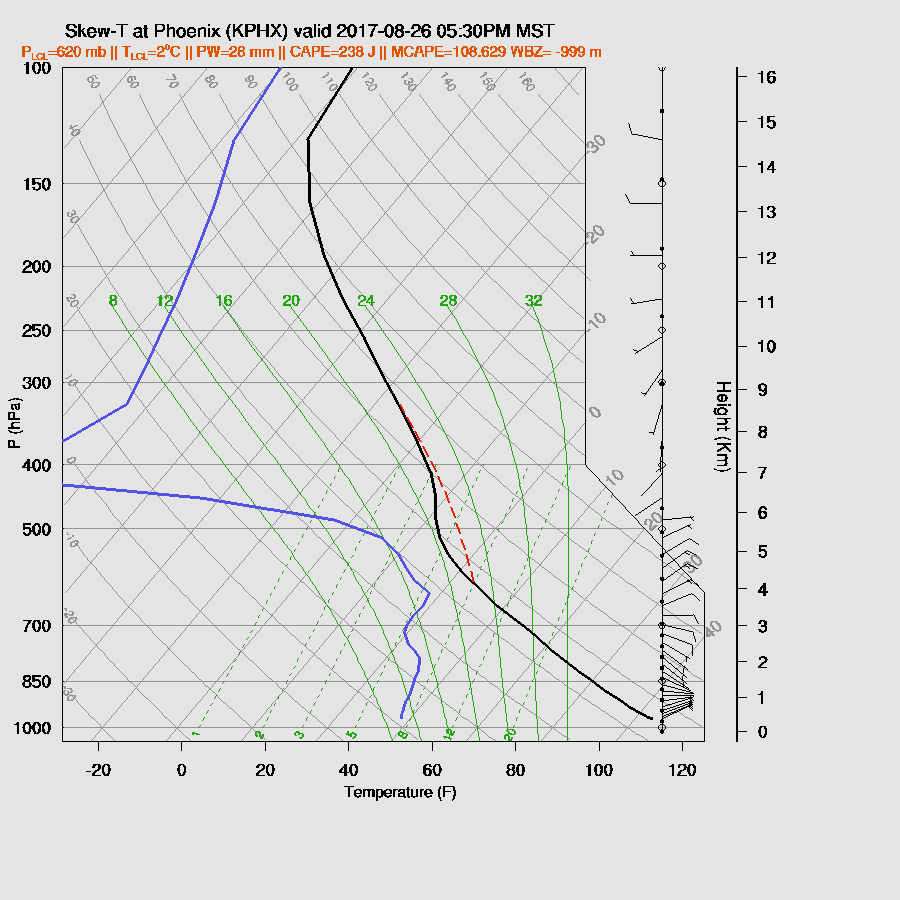
As always, it’s a tough call in and around Phoenix.  The WRFNAM keeps the PBL shallow in the Phoenix area due to the gulf surge. The WRFRRx (below) mixes fairly deeply by late afternoon accompanied by a moderate amount of CAPE as moisture slowly increases and mid level temperatures cool slightly. The wind field is poor with mainly unidirectional flow of only 10 to 20 knots below 500mb.

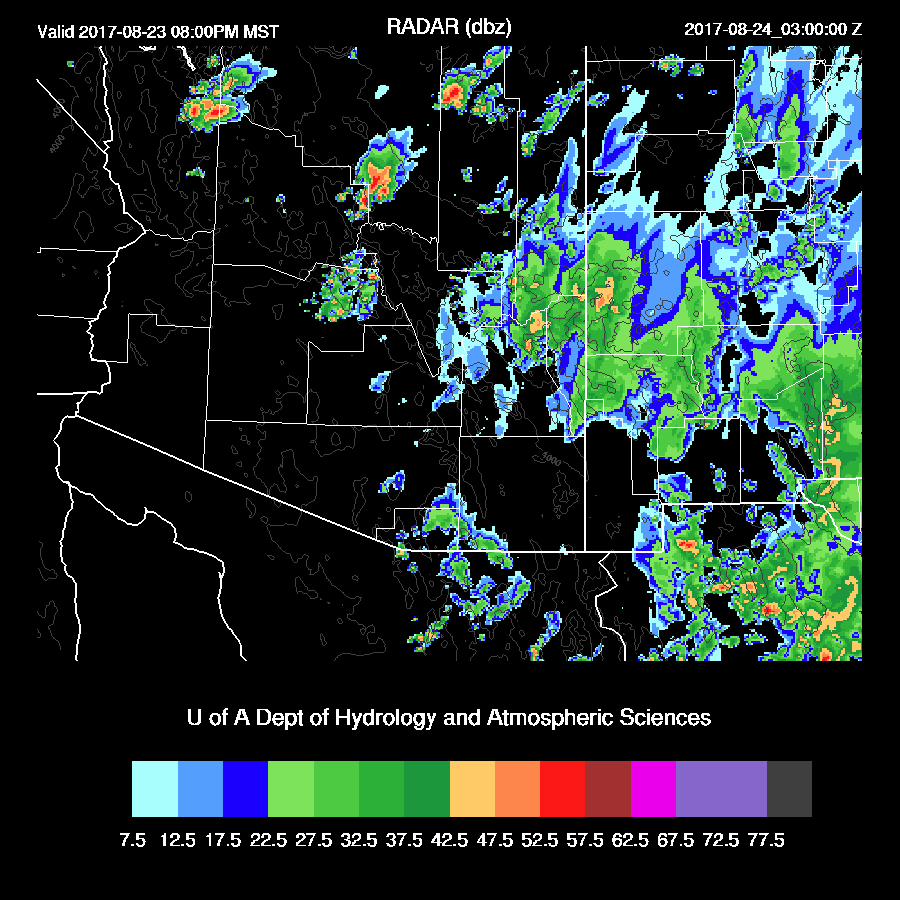
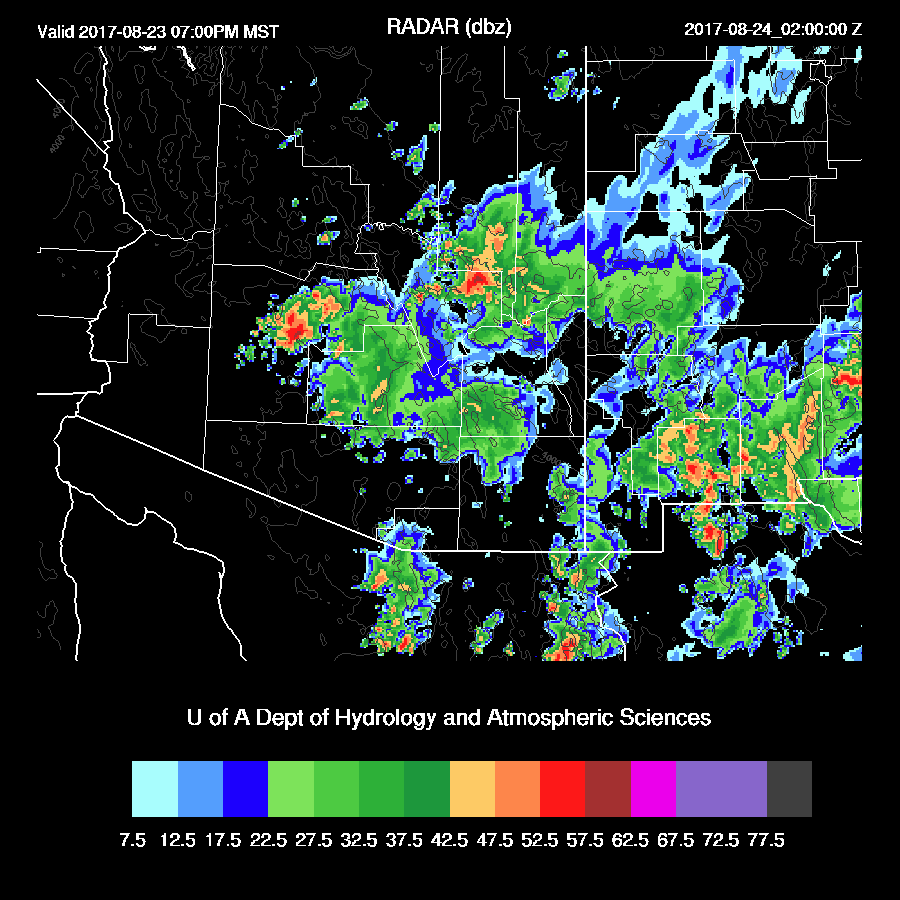
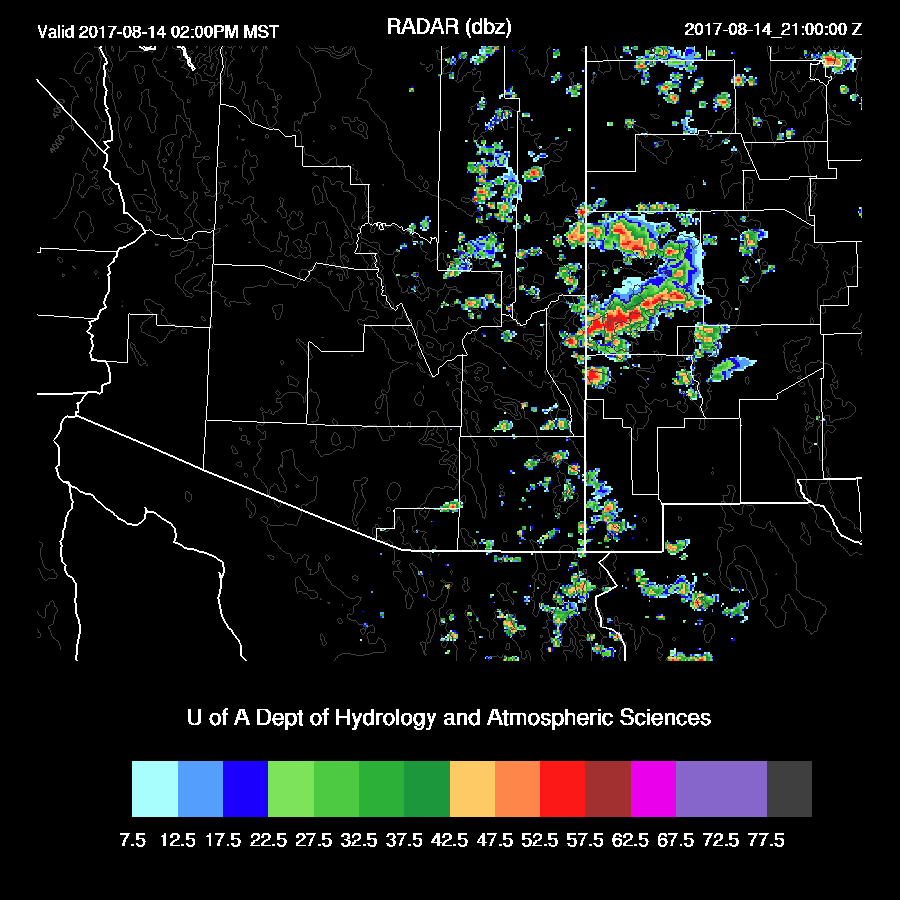
SE AZ storms develop along the outflow boundary into Pinal County by late afternoon or early evening.  


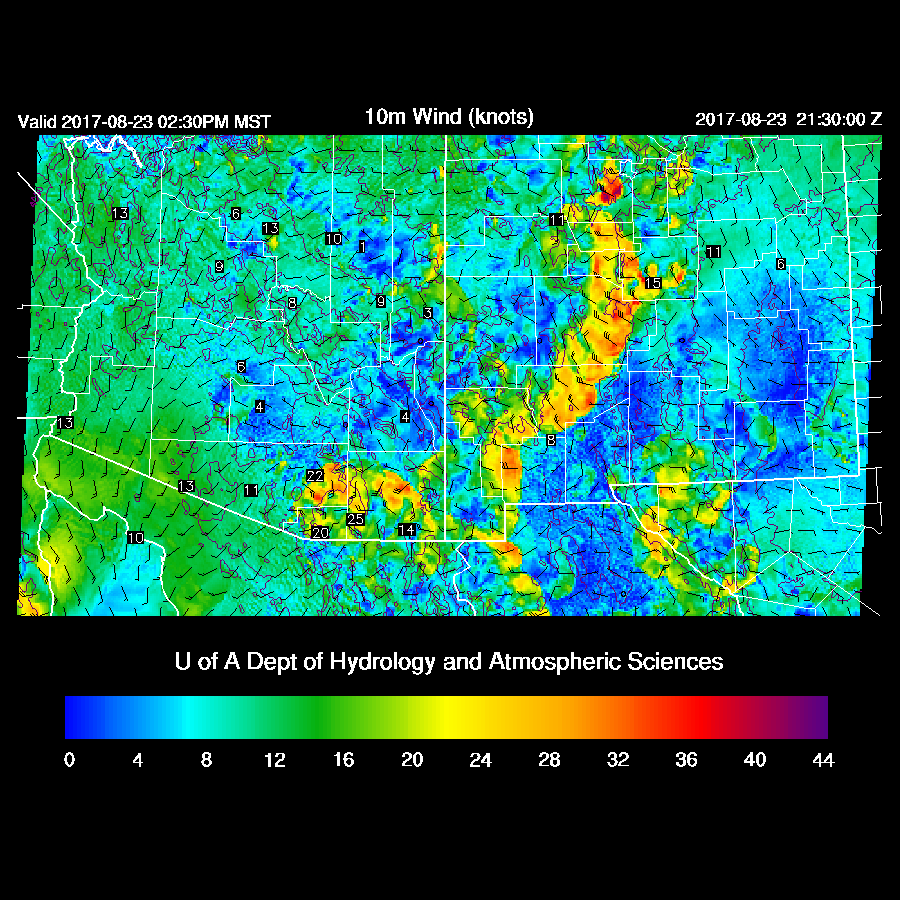
A moderate to strong outflow is ejected from this activity towards the Phoenix area.  There are no storms forecast to the north or northeast of Phoenix, thus no intersecting outflows, thus the question is if the outflow from the SE will be strong enough to trigger additional deep convection.


The answer is a definite ‘maybe’ as the WRFNAM does develop a few weak storms this evening.  


A quick peek at the 15Z WRFRRx shows more activity around Phoenix this evening.  The model forecasts may be an hour or two early.


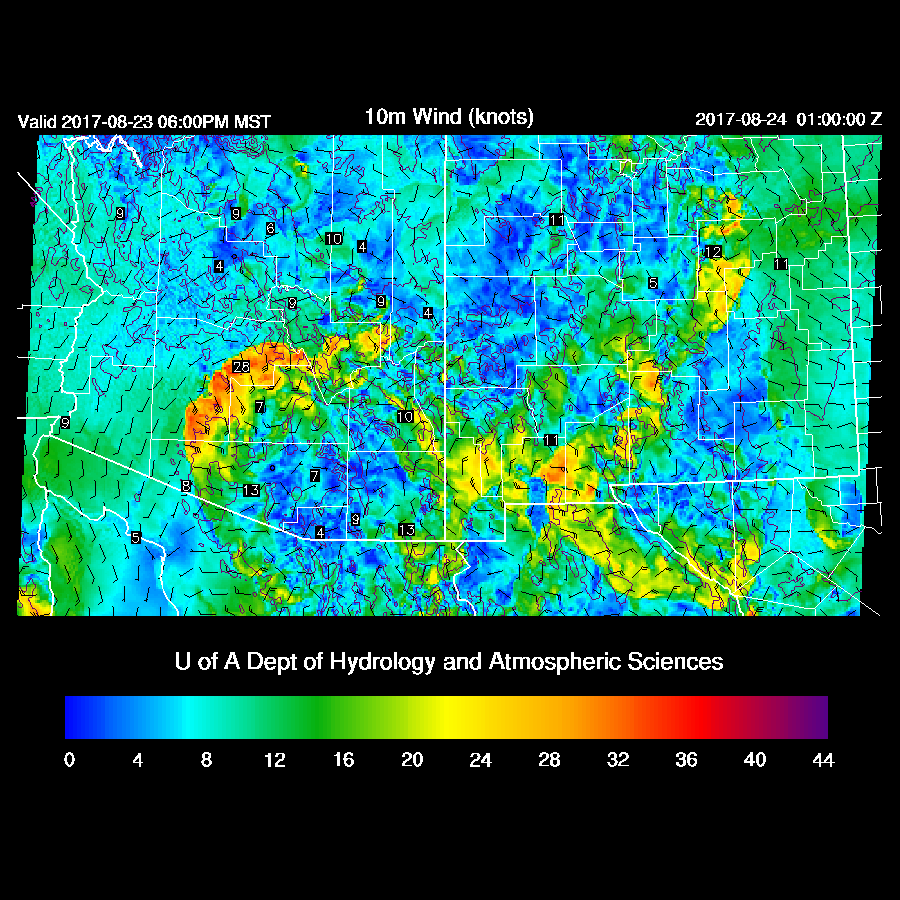
The 15z WRFRRx also has stronger outflow winds thus there is a risk of a large dust storm/haboob this evening for Phoenix.


Day 2
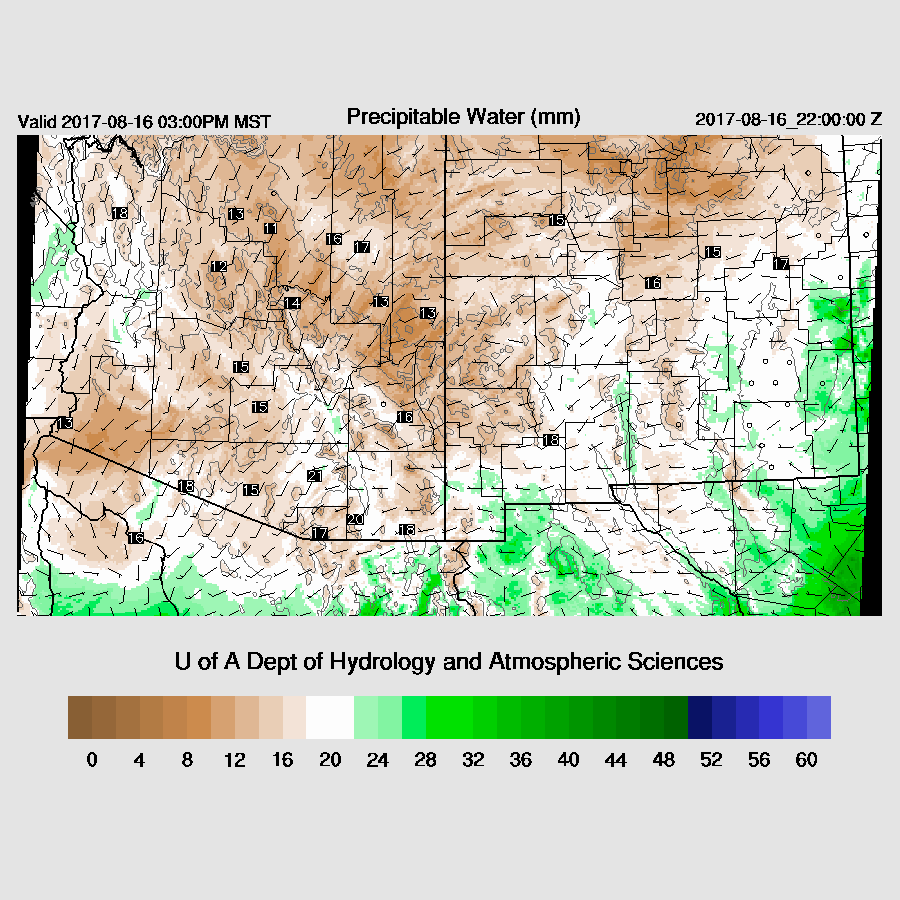
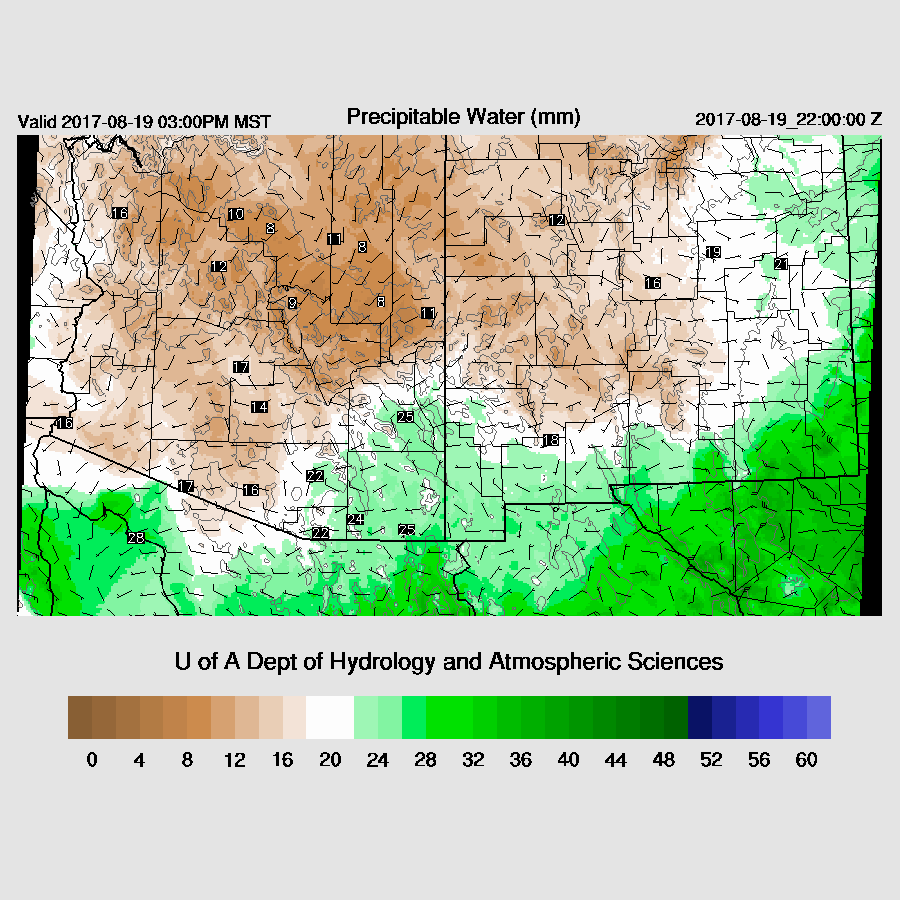
That was about it for the big return of the monsoon as very dry air once again advects into the state.  Activity is restricted to the higher elevations of eastern and northern Arizona.


Friday, August 18, 2017

AZ Eclipse Basics and Cloud Cover Climatology

WRF discussions will return when the storms return. In the meantime, enjoy yet another take on the upcoming eclipse!

Eclipse basics in Arizona

As you’ve almost certainly heard by now, a total solar eclipse will occur over a small swath of the United States on August 21, 2017, and a partial solar eclipse will occur over all the continental United States for approximately 3 hours. The path of totality sweeps from Oregon through South Carolina, while most of the continental United States will see the Moon cover at least 60% of the Sun. The map below, from https://eclipse2017.nasa.gov, shows the maximum obscuration across the U.S.


Arizona will see 55% (Nogales) to 78% (Four Corners) obscuration, with most of southern and central Arizona seeing about 60% obscuration. The plots below show the obscuration in Tucson and Phoenix on the morning of August 21, 2017.

Mid-August, mid-morning cloud cover in Tucson

We'll post the UA-WRF cloud cover and irradiance forecasts if/when we think it has something to add to the echo chamber. In the meantime, I looked at the climatology of cloud cover in mid-August in southern Arizona. There are a number of ways to approach cloud cover climatology (google “eclipse cloud cover”), but because our group has a focus on renewable energy forecasting, and because academia loves novelty, we’re going to look at irradiance observations. Also, many of the eclipse cloud cover climatology maps are based on satellite data analyses that have some serious errors.

Eclipse viewers will be most concerned with whether or not they can directly look at the Sun (through safe viewing glasses, of course) or if clouds will block their view. The relevant quantity for this is the direct normal irradiance. The direct normal irradiance (DNI) is the amount of light that comes directly from the Sun to a point on the Earth, rather than being scattered or reflected by particles or clouds in the atmosphere. DNI is very sensitive to cloud cover.

The figure below shows the DNI recorded at the University of Arizona for the week surrounding August 21st of the last six years. The measured data is green and, for comparison, the computed clear sky value is blue. The precipitable water measured by the Tucson 0Z and 12Z soundings is shown at the top of each subplot (in mm). The 9:00 to 12:00 area (approximately the eclipse duration in AZ) is shaded in grey. (Better rendered figures in the code link at the bottom.)


About 50-60% of the mornings are totally clear. Another 20-30% of the mornings are partly cloudy, and about 10% of the mornings are cloudy.

We can be more quantitative by computing the average clear sky index during each of the mornings shown in the figure above. The clear sky index is the ratio of measured irradiance to clear sky irradiance, so cloudy = 0%, clear = 100%, and partly cloudy skies are between 0 and 100%. Note that instrument and clear sky modeling uncertainties can yield clear sky indices slightly above 100%.

The plot below shows the morning average clear sky indices ranked from largest (clear) to smallest (cloudy). We see that 50% of the mornings have a clear sky index of at least 95% (essentially clear), and almost 95% of the mornings have a clear sky index of at least 40% (partly cloudy). Based on this climatology analysis, there’s about a 95% chance that you’ll be able to see the Moon take a bite out of the Sun at some point during the morning of the 21st in Tucson.

Next, I looked at morning average clear sky index vs. precipitable water (below). No surprise that it’s nearly clear when PW is less than 30 mm. Above 30 mm, there’s not an obvious correlation between clear sky index and PW. The three totally cloudy mornings all occurred with PW greater than 35 mm. For what it’s worth, the mean values are shown in the green point.


For reference, here are the same figures computed using the global horizontal irradiance (GHI). GHI is the total irradiance incident on a horizontal surface, and it includes both the projected direct sunlight and the scattered/diffuse sunlight. GHI is less sensitive than DNI to cloud cover because clouds scatter some of the incident sunlight to the surface even when they fully block the direct beam.


Resources

Code to reproduce all figures (and better looking figures) is available in a Jupyter Notebook here: http://nbviewer.jupyter.org/gist/wholmgren/b763174072a2d8592b2049a95800c2c2

The irradiance data is recorded in partnership with NREL, and is available here: http://midcdmz.nrel.gov/ua%5Foasis/

Eclipse obscuration calculations were made using the PyEphem library.

Solar irradiance calculations were made using the pvlib-python library.

Radiosonde data was downloaded and processed using the MetPy library.

Monday, August 14, 2017

20170814

Previous Day
Not much activity occurred over the lower deserts.  Higher elevations, especially over and north of the Rim/White Mountains was active with some locations receiving very heavy rain.  A few storms formed late at night near the Phoenix area.


The WRFNAM and the 15Z WRFRRx (below) were the best as the other two runs had too much activity around/in the Tucson area.  The WRFRRx also was able to get some of the late night activity near Phoenix.


Initializations
The 500mb map is nearly identical to yesterday and I had to check to make sure it was actually the 14th I was looking at.  A blocking pattern continues with the ridge centered in northern Canada and Arizona is in mainly 15 to 20 knot westerlies with a few weak troughs embedded in the flow.   It is mostly clear over Arizona and Sonora and all models initialized the simple synoptic/mesoscale situation well.  The only (minor) problem is that the RRx and NAM initialized somewhat too wet over Sonora.


Day 1
Moisture had gradually decreased over western and central Arizona since yesterday while areas from Tucson eastward are still quite wet.  Dry air continues to advect into all parts of the state during the day with very dry air over western Arizona.


This afternoon, far SE Arizona does hold on to enough moisture to support a few storms as 850mb dewpoints remain above 10C.


The White Mountains and eastern Rim also have enough moisture and CAPE to support some deep convection this afternoon.


Storms are restricted to far eastern/southeastern Arizona today.


Day 2 (and beyond)
It may be awhile before moisture and this discussion return.