WRF discussions will return when the storms return. In the meantime, enjoy yet another take on the upcoming eclipse!
Eclipse basics in Arizona
As you’ve almost certainly heard by now, a total solar eclipse will occur over a small swath of the United States on August 21, 2017, and a partial solar eclipse will occur over all the continental United States for approximately 3 hours. The path of totality sweeps from Oregon through South Carolina, while most of the continental United States will see the Moon cover at least 60% of the Sun. The map below, from https://eclipse2017.nasa.gov, shows the maximum obscuration across the U.S.

Arizona will see 55% (Nogales) to 78% (Four Corners) obscuration, with most of southern and central Arizona seeing about 60% obscuration. The plots below show the obscuration in Tucson and Phoenix on the morning of August 21, 2017.


Mid-August, mid-morning cloud cover in Tucson
We'll post the UA-WRF cloud cover and irradiance forecasts if/when we think it has something to add to the echo chamber. In the meantime, I looked at the climatology of cloud cover in mid-August in southern Arizona. There are a number of ways to approach cloud cover climatology (google “eclipse cloud cover”), but because our group has a focus on renewable energy forecasting, and because academia loves novelty, we’re going to look at irradiance observations. Also, many of the eclipse cloud cover climatology maps are based on satellite data analyses that have some serious errors.
Eclipse viewers will be most concerned with whether or not they can directly look at the Sun (through safe viewing glasses, of course) or if clouds will block their view. The relevant quantity for this is the direct normal irradiance. The direct normal irradiance (DNI) is the amount of light that comes directly from the Sun to a point on the Earth, rather than being scattered or reflected by particles or clouds in the atmosphere. DNI is very sensitive to cloud cover.
The figure below shows the DNI recorded at the University of Arizona for the week surrounding August 21st of the last six years. The measured data is green and, for comparison, the computed clear sky value is blue. The precipitable water measured by the Tucson 0Z and 12Z soundings is shown at the top of each subplot (in mm). The 9:00 to 12:00 area (approximately the eclipse duration in AZ) is shaded in grey. (Better rendered figures in the code link at the bottom.)

About 50-60% of the mornings are totally clear. Another 20-30% of the mornings are partly cloudy, and about 10% of the mornings are cloudy.
We can be more quantitative by computing the average clear sky index during each of the mornings shown in the figure above. The clear sky index is the ratio of measured irradiance to clear sky irradiance, so cloudy = 0%, clear = 100%, and partly cloudy skies are between 0 and 100%. Note that instrument and clear sky modeling uncertainties can yield clear sky indices slightly above 100%.
The plot below shows the morning average clear sky indices ranked from largest (clear) to smallest (cloudy). We see that 50% of the mornings have a clear sky index of at least 95% (essentially clear), and almost 95% of the mornings have a clear sky index of at least 40% (partly cloudy). Based on this climatology analysis, there’s about a 95% chance that you’ll be able to see the Moon take a bite out of the Sun at some point during the morning of the 21st in Tucson.

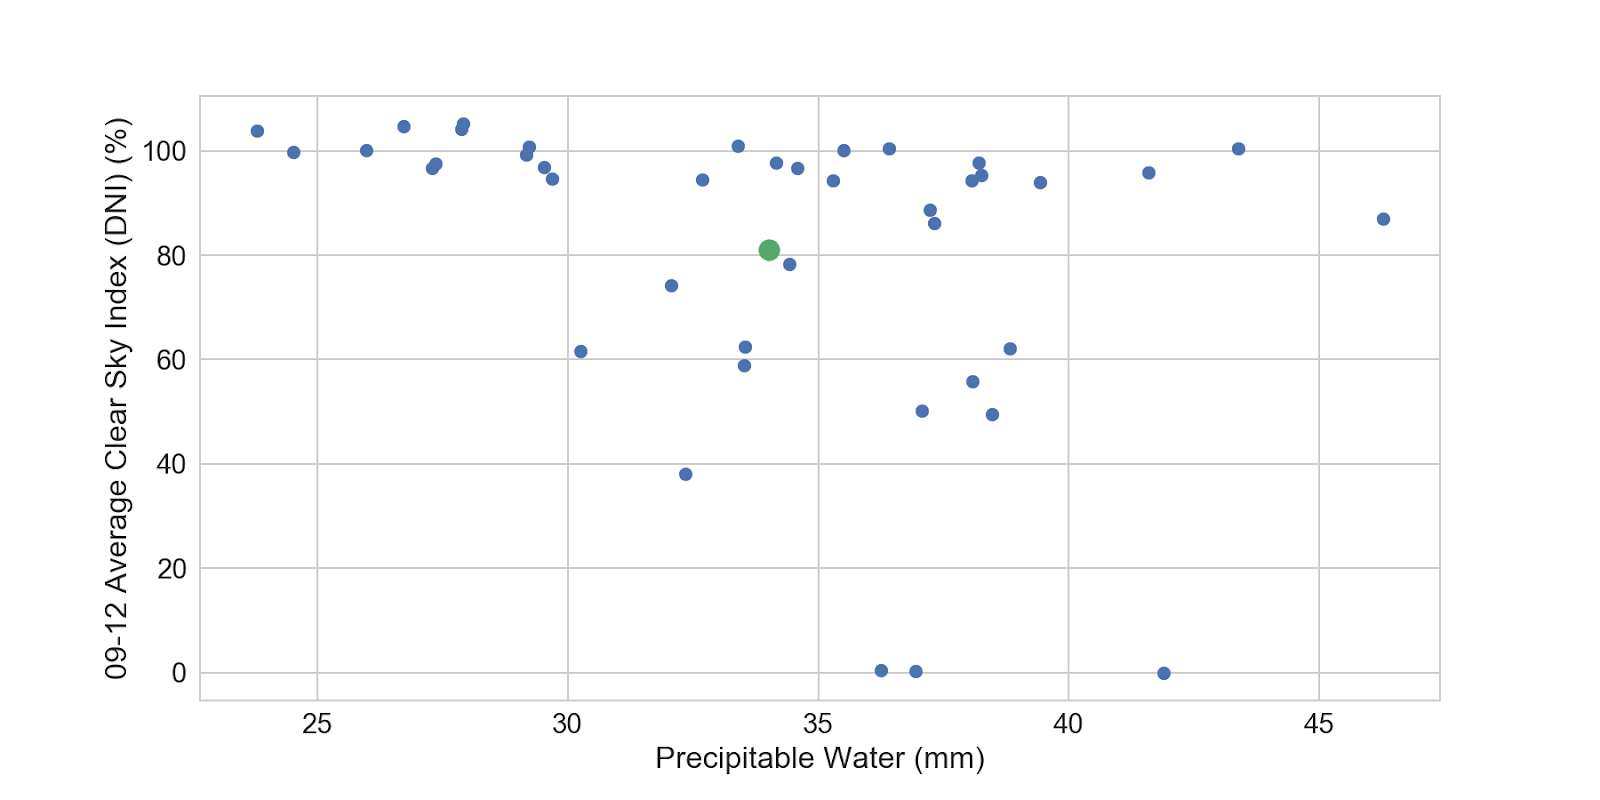
Next, I looked at morning average clear sky index vs. precipitable water (below). No surprise that it’s nearly clear when PW is less than 30 mm. Above 30 mm, there’s not an obvious correlation between clear sky index and PW. The three totally cloudy mornings all occurred with PW greater than 35 mm. For what it’s worth, the mean values are shown in the green point.
For reference, here are the same figures computed using the global horizontal irradiance (GHI). GHI is the total irradiance incident on a horizontal surface, and it includes both the projected direct sunlight and the scattered/diffuse sunlight. GHI is less sensitive than DNI to cloud cover because clouds scatter some of the incident sunlight to the surface even when they fully block the direct beam.


Resources
Code to reproduce all figures (and better looking figures) is available in a Jupyter Notebook here: http://nbviewer.jupyter.org/gist/wholmgren/b763174072a2d8592b2049a95800c2c2
The irradiance data is recorded in partnership with NREL, and is available here: http://midcdmz.nrel.gov/ua%5Foasis/
Eclipse obscuration calculations were made using the PyEphem library.
Solar irradiance calculations were made using the pvlib-python library.
Radiosonde data was downloaded and processed using the MetPy library.
No comments:
Post a Comment
Note: Only a member of this blog may post a comment.